March 8, 2018

Energy Systems Used at Maine Huts & Trails

[Homework Assignment due 15-Mar-18 @ 8am]

Composting Toilets:

foam-flush-toilet-lg
cloves new england

The composting toilet system at Flagstaff Hut was manufactured by Clivus New England. The manufacturer’s web site has a good link to the the technology. Key components of the system include toilets that flush with a 3 oz water/foam mixture, waterless urinals, and a central composting camber in the basement of the hut. The compost pile is kept warm, oxygenated, and moist to facilitate aerobic oxidation of human dejecta. Human waste is mostly water (Composition of Human Dejecta) and organic carbon so the oxidation of waste produces carbon dioxide and water vapor that leave the compost chamber as gas. The residual solids are mostly inorganic phosphorus, calcium, and potassium salts that represent less than 10% of the initial waste volume. 1) An interesting calculation would be the expected annual mass of composted material produced by 500 hut visitors per month.

http://www.eautarcie.org/en/05e.html

Interesting technical challenges are the physical limitations of component placement since gravity and very low water volumes are used to carry waste from the bathrooms to the compost facility. The Clivus system does require regular maintenance and, therefore, requires easy access.

Clivus installation example

Urine is high in nitrogen and the composting process converts most of the nitrogen, urea, to soluble nitrate or nitrite that collects in the liquid sump in the bottom of the composter. This liquid is pumped out of the system and added to the gray water of the hut. It would be interesting to know more about the gray water system and regulations on gray water system placement in Maine. Would it “pay” to install this system in your own home? What is the market for Clivus systems. The hut crew sold the benefits of the system based on water savings? Is this the real environmental and economic cost?

Heating System

Tarm Boiler
Tarm Boiler

The heating system was manufactured by Tarm Biomass. The HS Tarm Solo Innova 50 boiler is about 80% efficient, has a normal output of 171,000 BTU/hr, and the hut burns about 20 cords of dry wood per year to heat the buildings and produce hot water. The plumbing schematics from Tarm are pretty close to the installed system.

2) Interesting calculations would be the total energy produced by 20 cords of wood in BTUs and joules and equivalent amount of oil or natural gas required to produce this amount of heat. The Flagstaff Hut installation uses an 850 gallon water tank to store heat from the Tarm boiler. Assuming the water used for storage has a temperature swing of 100 oF (80–> 180), what is the total heat stored in the tank and how long would it take the boiler to produce this much heat. Why was my shower cold on Saturday morning? The hut uses a backup propane heater which they use in the summer. Why is the backup heater important? Would it “pay” to install this system in your own home?

Electrical System

Pika Energy Systems – the future?

Outback Off-Grid Power System

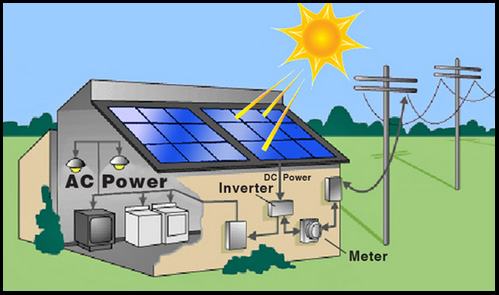
The hut runs on standard 120/220 volt electrical service. The hut is not connected to electrical grid and must generate all of the electrical power using solar panels and a propane generator. The solar panels produce 5.6 kW of DC electrical power at peak performance and store this energy in twenty four, two volt, lead/acid batteries. The total capacity of the batteries is 24 kW-hr. As a good assumption, a solar system rated at 1 kW of power at full sum will produce 1000 kW-hr of total electrical energy in one year (stay tuned for this calculation).

The solar panels can not meet the entire electrical demand of the hut so a propane generator is used to supply additional power. The generator uses about 400 gallons of propane a year. Key to operation of the system is the Outback inverter/control system that can charge the batteries from AC or DC power inputs and deliver power to the hut from AC (generator) or DC outputs (battery).

A few basics on propane generators:

  • It requires 2 horsepower to produce 1000 watts of energy per hour under load.
  • Under load, each horsepower consumes 10,000 BTU per hour.
  • Propane contains 92,000 BTU per gallon.
  • Propane weighs 4.2 pounds per gallon.

The hut crew mentioned that the generator always came on when the guests were using a lot of water and suspected that the water pump was using a lot of power. Pumping water requires very little energy (work = mgh) once the pump is started. However, the starting load on the electrical system to start the pump is very large. One solution may be to install a smaller water pump. It would pump longer, but require a reduced starting load. If the Outback control system logs power usage it would be informative to look at the electrical load profile of the hut to determine if additional energy efficiency is possible.

3) Interesting calculations would be the total electrical energy produced by the solar and generator systems over the entire year. How does the fuel-only cost of these systems compare to residential electrical costs of 0.13 $/kWh? If an installed propane generator costs $5000 and the hut’s solar system costs $25,000 what is the simple 25 year cost of running both systems?

Further Reading:

Home Power

Off-Grid Feasibility and Sustainable Load Shifting

Clivus New England

Outback Power

Tarm Biomass

Rolls Battery, Look at a Spec Sheet

Maine Public Radio Story on Off-Grid homes – start at 6 minutes

March 6, 2018

Final Project: Building Energy Systems Review for SSW

Due date: May 10th, 2018 @ 8am

Teams:

  1. Heating & Cooling systems
  2. Electrical systems
  3. Comfort survey

Some questions to think about:

1. How does actual building energy performance compare to what was expected at time of LEED certification?

2.  Benchmark the building energy performance per LEED requirements. Does it meet the minimum energy performance threshold?

3.  Identify at least three (?) energy conservation measures. Calculate savings, costs, simple payback. Consider lighting, lighting controls, HVAC/controls, any issues identified by occupant comfort survey.

4.  Is the geothermal system performing as expected?

5.  Is it possible to calculate energy by end use? Hating, cooling, lighting, plug loads?

6.  Conduct thermal comfort survey

https://www.usgbc.org/credits/existing-buildings-schools-existing-buildings-retail-existing-buildings-hospitality-exist-25

Grossman comfort survey

7.  Compare SSW  LEED certification to current LEED version 4 requirements. Would SSW meet the new requirements?

8.  Calculate carbon emissions savings from geothermal systems and the PV array. What are the associated financial costs and savings? Does this approach make sense for future campus buildings? If so, under what conditions?

March 5th Lab

Meet in the lobby of the Shair-Swenson-Watson building (next to the Davis building) at 1pm for a tour of the energy systems in this building

Miscellaneous tidbits of information:

  • Colby’s renewable energy credits (RECs) would be worth $250/MWh if the energy were produced in Massachusetts. Here in Maine, ours are worth around $24-$28 per MWh. We would expect a total of $55,000-$65,000 per year if we sold our solar RECs in the Massachusetts market (2,300 MWh). In contrast, we recently paid $0.49/MWh for 15,300 MWh worth of RECs (~$7500 for RECs to offset all campus purchased electricity).
  • Shair-Swenson-Watson (SSW) Solar Production (Excel worksheet)
  • Thermal comfort Survey developed for the Grossman Renovation and designed to meet the requirements of the LEED credit.
  • SSW energy systems snapshot
  • Recent energy use data from SSW (Excel worksheet)
  • Do we have sewer/water and trash/recycling data by building? If not, we may be able to get plumbing fixture counts and flow rates off the building construction drawings and we can do some calculations.
  • Climate Data for thermal and solar analysis:  Colby Quad_48Colby Quad_47Colby Quad_46Colby Quad_45Colby Quad_44Colby Quad_43Colby Quad_42

February 26th Lab

NREL System Advisor Model (SAM)

In this lab your will perform a full system and financial analysis of a residential solar installation.    You will need the following.

1. Location of your home (or the property for which you are doing this analysis) – GPS coordinates preferred (use Google Earth)

2. Approximate angle of the roof

3. Compass orientation of the roof

4. A typical electric bill with 12 months of power consumption

Before lab review this tutorial for SAM

5. You should also be prepared to estimate the interest rate for any debt financing of the system and an estimate for the annual increase in the price of power.

6. Run the full SAM simulation on your project. Modify the model to test the range of reasonable assumptions for interest rates and electricity pricing.

7. Export the results of each run as a CSV file and import the date into Excel.   Define the meaning of each row in the simulation and track the calculations. Build a new calculated row to calculate the total cash flow of the project as a function of year.

8. Tabulate the results from each simulation paying attentions to the output functions: Nominal LCOE, Net present value, Internal Rate of Return, and Payback period.  Define each of these terms.  Calculate the Net Present Value and Internal Rate of Return in Excel using the modeled payments for life of the solar system.

9. Now considering the results of your analysis, why wouldn’t every electricity customer consider solar?

Example Files from Lab:
King Example for Class 2018  this is the Excel file
King Example for Class 2018  this is the SAM report

Resources
Google’s Project Sunroof
National Renewable Energy Lab: System Advisor Model
GBS-pricing-schedule
Post Tariff PV pricing

Reports & Analyses
Professor King’s home:
Solar Electric Proposal (Garage Roof 18 Renesola 255w)
Solar Shade Analysis
King PV system analysis.zsam

Professor Donihue’s home:
Solar Shade Analysis
Solar Electric Roof Project
– SAM analysis for roof project (Model file; Excel download)
Solar Electric Tracking Proposal
Solar Domestic Hot Water Proposal

– Electricity bill for January 2018

February 22nd

Go Solar!

Solar Cells Intro
Solar Cell Theory I:  https://www.ossila.com/pages/solar-cells-theory
Solar Cell Theory II: https://en.wikipedia.org/wiki/Theory_of_solar_cells

Power Output of Panels
Panel Performance

Revision Energy   Slide show
Solar Electric Tracker Proposal
Solar Electric Roof Proposal (305W PV system)
Solar Electric Roof Proposal (255W PV system)
Solar Electric Roof Proposal – King (255W PV System)
lSolar Electric Proposal – King (InSource, King PV Proposal 2016 Final)
Solar Pro: Levelized Cost of Energy explained

Resources

NYT April 18, 2015: Solar Power’s impact on electric companies in Hawaii
Bangor Daily News, March 12, 2015: The value of solar power
Maine Distributed Solar Valuation Study and Addendum
Micro-grids: The Stafford Hill Solar Farm in Vermont
NRG Energy, Green Mountain Power roll our micro-grid for Vermont
ISO New England
MIT Technology Review: The Great German Energy Experiment
MIT Technology Review: Solar Power and Somewhere to Store It
How long does it take for photovoltaics to produce the energy used?
Domestic and overseas manufacturing scenarios of silicon-based photovoltaics: Life cycle energy and environmental comparative analysis
Liquid Batteries for Solar and Wind Power, NYT 23-Apr-15
Action Spectra of Plants

Surface Orientation Graphic