On February 27th, 2019, the New York Times published an article about a report that was recently released by a non-profit called EdBuild that found that in 2016 non-white school districts (defined as school districts with more than 75% students of color) received a total of $23 billion less in funding than white school districts (define as school districts with more than 75% white students). They note that this breaks down to spending about $2,200 less per student.
The New York Times article explains how districts get their funding: they rely mostly on local taxes, which has led to small, wealthy communities separating themselves so that their high tax dollars are used to fund small schools for their children and the children of their wealthy neighbors. Since race and income are strongly tied, this means that white school districts get significantly more funding than non-white. States are supposed to distribute funding to make up for some of this inequality, but the article says that this is not happening: there is a significant difference in the total and per student amount of funding that districts get based on the socioeconomic status of their inhabitants.
But does the amount of funding that a district gets in total or per pupil affect the achievement gap? The New York Times article relays a few impacts of the lack of funding for the non-white districts such as “older, worn textbooks and… less access to computers,” but fails to address the complicated relationship between funding and the achievement gap. In 2018, Rutgers Schools of Education professor Bruce D. Baker and Education Law Center staff Danielle Farrie and David Sciarra published a report called “Is Funding Fair? A National Report Card.” In it they complete a comprehensive review of public school funding at the state level, controlling for effects of confounding variables such as cost of living. They ranked each state from 1-49 (excluding Hawaii) on a factor they called “Funding Level”, which they define as the amount spent per pupil on education. A comparison of these ranks to the achievement gap between low-income and not-low-income students on the National Assessment of Educational Progress (NAEP) 4th grade reading test, which a random sample of 4th grades across the country take every year, makes it clear that there is not a clear relationship between funding and the income achievement gap.
| State | NAEP 2017 4th Grade Reading Score Gap (Low Income Minus Not Low Income) | Baker Report Funding Level Rank |
| Alabama | -29 | 39 |
| Alaska | -34 | 2 |
| Arizona | -34 | 48 |
| Arkansas | -23 | 36 |
| California | -33 | 32 |
| Colorado | -29 | 35 |
| Connecticut | -29 | 6 |
| Delaware | -19 | 10 |
| Florida | -23 | 41 |
| Georgia | -32 | 37 |
| Hawaii | -26 | 49 |
| Idaho | -23 | |
| Illinois | -29 | 16 |
| Indiana | -23 | 20 |
| Iowa | -28 | 18 |
| Kansas | -22 | 25 |
| Kentucky | -22 | 34 |
| Louisiana | -30 | 28 |
| Maine | -26 | 14 |
| Maryland | -28 | 12 |
| Massachusetts | -24 | 7 |
| Michigan | -28 | 24 |
| Minnesota | -29 | 13 |
| Mississippi | -32 | 44 |
| Missouri | -26 | 31 |
| Montana | -24 | 30 |
| Nebraska | -27 | 21 |
| Nevada | -30 | 42 |
| New Hampshire | -25 | 11 |
| New Jersey | -29 | 5 |
| New Mexico | -32 | 33 |
| New York | -23 | 1 |
| North Carolina | -25 | 47 |
| North Dakota | -21 | 19 |
| Ohio | -27 | 15 |
| Oklahoma | -23 | 45 |
| Oregon | -29 | 27 |
| Pennsylvania | -29 | 8 |
| Rhode Island | -29 | 9 |
| South Carolina | -31 | 26 |
| South Dakota | -23 | 40 |
| Tennessee | -25 | 43 |
| Texas | -26 | 38 |
| Utah | -26 | 46 |
| Vermont | -26 | 3 |
| Virginia | -26 | 29 |
| Washington | -32 | 23 |
| West Virginia | -18 | 22 |
| Wisconsin | -29 | 17 |
| Wyoming | -20 | 4 |
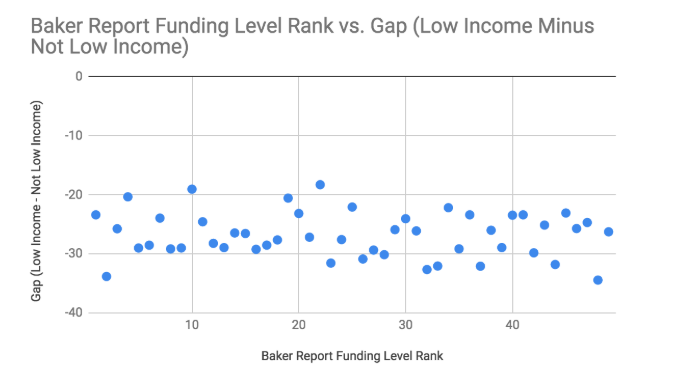
State-level NAEP 2017 4th Grade Reading Income Achievement Gap compared to Funding Level (amount spent per pupil for education). The scatterplot indicates there is little to no correlation between the two variables.
Linda Darling-Hammond, professor of education emeritus at Stanford University, suggests that school funding is important, but only if it is used in thoughtful ways that will benefit student achievement. She says that particularly paying more for high quality teachers, smaller class sizes, and preschool can make huge impacts on the achievement of students with low socioeconomic status. She summarizes her point by saying, “Clearly, money well spent does make a difference. Equalizing access to resources creates the possibility that all students will receive what should be their birthright: a genuine opportunity to learn.”
The report that the New York Times article is referencing begins with a warning that: “Good schools can’t solve structural inequality on their own, but neither can it be solved without them.” This highlights the fact that even creating better more equitable schools through more equitable funding or other changes will not be able to totally close the achievement gap because there also need to be changes made in the larger society to make the world a more equitable place.
Thus, while the New York Times article makes an important point about lack of funding in poor, non-white school districts, it fails to make note that just giving all districts the same amount of money would not eliminate the achievement gap: the funding needs to be used in specific ways to benefit high risk students in combination with other societal changes to create an education system that serves all students equitably.
For further analysis of the EdBuild report, see Amber Churchwell’s post here.
Post by: Kayla Freeman