# The following code snippet was inspired from a post
# in Stats.StackExchange.com (link to the exact post
# was lost)
# Define number of intervals
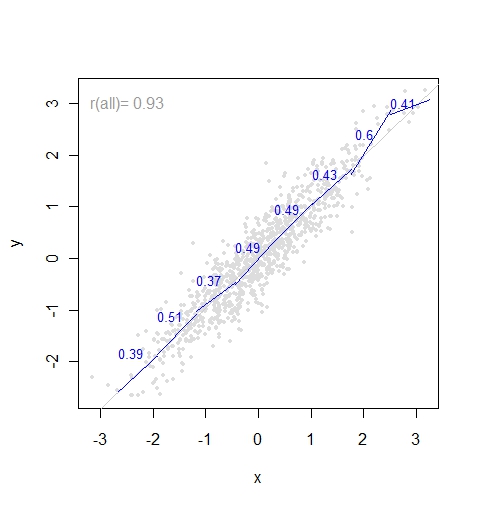
num.int = 8
# Generate simulated data
x = rnorm(1000,0,1)
e = rnorm(length(x),0,.4)
y = x + e
# Plot all data point with regression line
plot(y~x, cex=.5, col="#DDDDDD", pch=16)
dat.lm = lm( y~x )
abline(dat.lm,col="#CCCCCC")
# Define additional paramaters
usr = par("usr") # Needed to set extent to all later in code
cor.y = numeric()
j = 1
int = diff(range(y))/num.int # incremental interval
# Loop through each segement and compute r and reg line
for (i in seq(min(y), max(y), int)){
xi = which(x >= i & x < i+int)
cor.y[j] = cor(y[xi],x[xi])
clip(x1=i, x2=i+int, y1=min(y[xi]), y2=max(y[xi]))
sub.lm = lm( y[xi]~x[xi] )
abline(sub.lm, col="blue" )
do.call("clip", as.list(usr)) # reset to plot region
text(i+0.25,quantile(sub.lm$model[,1])[4],col="blue",
as.character(format(cor.y[j],digits=2)),cex=0.8)
j = j +1
}
# Plot overall r value
do.call("clip", as.list(usr)) # reset extent to plot region
text.r text(-2.5,3,text.r,col="#999999")