# What's the probability of getting a high correlation
# from a very small sample of uncorrelated variables
x = rnorm(200,50,20)
y = rnorm(200,50,20)
# Check that x and y are not correlated
cor(x,y) # THis should return an r close to 0
# Grab a very small sample and compute the
# correlation coefficient. Repeat this i times
# to generate a distribution of possible r values
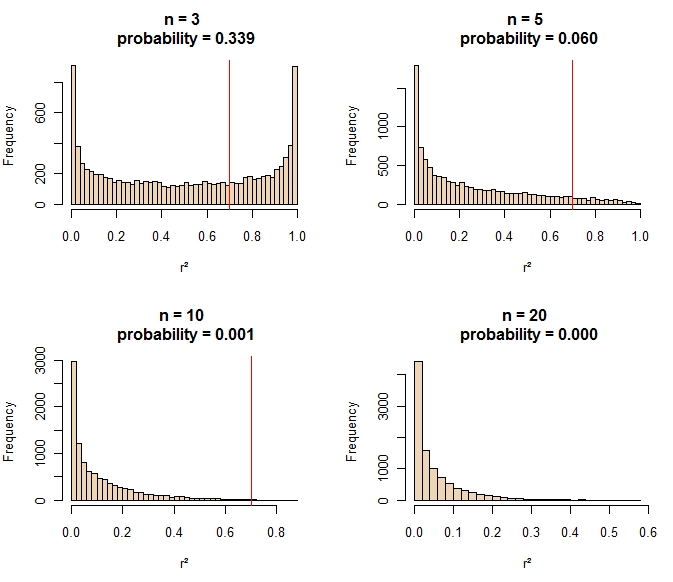
n = c(3,5,10,20) # sample size. Try n=3,5,10 and 20
par(mfrow=c(2,2))
for (j in 1:length(n)){
corxy =vector()
for (i in 1:10000){
xs = sample(x,n[j],replace=F)
ys = sample(y,n[j],replace=F)
corxy[i] = cor(xs,ys)
}
# What's the probabily of getting r² > 0.7
cor.ecdf = ecdf(corxy^2)
cor.p = 1 - cor.ecdf(0.7)
# Plot the distribution of r²
hist(corxy^2,breaks=40,col="bisque2",xlab="r²",
main=paste("n =",n[j],"\n","probability =",sprintf("%4.3f",cor.p)))
# Plot r² = 0.7 on the histogram
abline(v=0.7,col="red")
}