The Lower Merion School District is a public school district located outside of Philadelphia for grades K-12. LMSD is a fairly affluent, primarily white, and extremely well funded school district.
In 2018, the township was reported as 84.2% white, with 77.7% of the 25+ holding a bachelor’s degree or higher and 5.2% of the population living in poverty (see here ). Despite the excellent public schools offered in the district, there is still a substantial achievement gap present (see fig. 1). After examining data on the passing rates of the Pennsylvania System of School Assessment Exam (PSSA) this gap presents itself in a startling manner. PSSA data is reported in the categories of “All Students” and “Historically Underperforming,” so when interpreting this data it is important to remember that the historically underperforming student scores are being calculated into the all student passing rates.
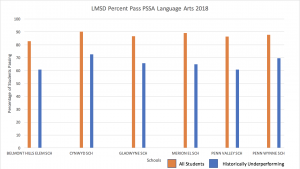
Figure 1 (2018 data found here)
The elementary school that I attended, Penn Valley Elementary, has historically performed the lowest of the six elementary schools and has frequently has the largest gap in achievement. In 2018, historically underperforming students passing rates were about 25.5% below that of all students. Penn Valley has the highest percentage of non-white students (35%) and the highest percentage of students receiving free/reduced lunch (12.7%), compared to a district average of 24.1% being non-white and 9.2% of students receiving free/reduced lunch across the six schools. The testing results of Penn Valley align with my schooling experience. Penn Valley serves a few very distinct communities, one of the wealthiest in the townships and one of the poorest. The combination of these two communities into one school contributes to the largest achievement gap, as the other elementary school serve more socioeconomically homogenous populations.
Belmont Hills Elementary School has a similar percentage of students receiving free and reduced lunch as Penn Valley, with roughly 12.4% of students qualifying for the program. However, Belmont Hills is comprised of 9.7% minority students, which is a much smaller percentage than Penn Valley’s 35%. Belmont Hills has a pretty large achievement gap, with historically underperforming students passing at a rate of 22% less than all students. Additionally, its overall passing rates are the lowest of the 6 schools, with 82.7% of all students passing the assessment. This suggests that in LMSD, economic status is perhaps a larger influence on the achievement gap than race.
I am somewhat shocked by the results as I expected the six schools to be more similar in their achievement levels and their achievement gaps. All of the schools have practically identical access to different programs, teacher quality and curriculum, the only difference is slight variations in the makeup of their student bodies. These results corroborate Coleman’s findings that outside of school factors impact the widening of the achievement much more than school factors (see here). Despite the fact that students in LMSD have access to excellent resources, the achievement gap persists, suggesting that high quality instruction and access to numerous in school resources is not enough to close the gap.
Post by: Julia Manning